Why diversification is a ‘free lunch’

7th September 2017
We sometimes read stories of companies that have seen meteoric rises in their value and it’s natural to wish we had invested everything in them when the shares traded for pennies. One such example is the shares of eBay, which have increased by over 5000% since the ‘90s.
However, if we wound back the clock, one could have just as easily been tempted to back one of its hotly-tipped competitors. An early investment in rival ‘uBid Inc’ would have lost over half its value in the first two years of trading. While those backing ‘OnSale.com’ would have seen the stock price plummet before it entered bankruptcy in 2001. Just as history is written by the victors, failed companies are consigned to the forgotten business sections of old newspapers.
Given the same choice today, how many investors would happily pour their entire life savings into the next ‘eBay’ when it could turn out to be the next ‘uBid Inc’ or ‘OnSale.com’?
Those that answer ‘yes’ have probably been blinded by the phenomenon of hindsight bias (thinking that an event was predictable after it has occurred). Lured in by the returns of eBay and increased media coverage of similarly monumental success stories it is perhaps more tempting than ever to believe that you can predict the next big ‘winner’. But doing so could cost you your entire investment as unfortunately there is no guaranteed way of distinguishing the next ‘eBay’ from the next ‘OnSale.com’. Even companies that seemed unassailable, like Nokia and Blackberry are fallible.
‘Even companies that seemed unassailable, like Nokia and Blackberry are fallible.’
To avoid the risk of losing everything, an investor might consider investing in more than one company or, in this example, all of the above. This would have reduced their risk by ensuring that the poor performance of one holding represented a smaller fraction of their overall investment. In this case, the success of eBay would cancel out the loss of investment in the other two companies but significantly reduce the investor’s overall return. The investor has essentially reduced both their risk and their potential return.
We’re often told that risk and return go hand in hand and the previous example supports this. But what if it were possible to reduce risk without a corresponding reduction in return?
This is where ‘correlation’ comes in. In the investment world, ‘correlation’ is a statistic that measures the degree to which two assets perform in relation to each other. A positive correlation means that the two assets perform well and badly at the same time as each other. A negative correlation means they perform well and badly at different times.
‘it is possible to reduce risk without a corresponding reduction in return.’
By investing in assets with low or negative correlations, it is possible to reduce risk without a corresponding reduction in return.
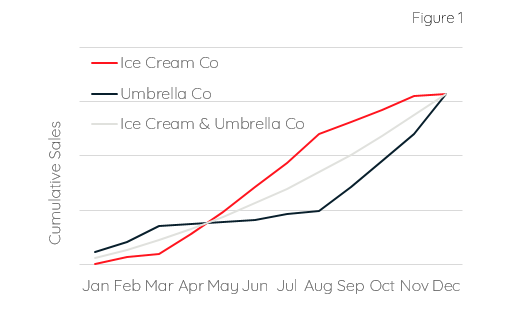
Imagine two companies, Ice Cream Co. and Umbrella Co. They both make the same profit over the whole year, but their monthly profits are affected by the weather. The graph below assumes their profits are perfectly negatively correlated.

Individually, the profits of each company are relatively volatile. However, if they were to combine forces, they would make the same return but with none of the volatility they had when operating individually. This is because of the negative correlation between the two companies’ profits, which means the variations are cancelled out.
In the real world, perfect negative correlation between two assets providing positive returns does not exist. But whilst it might not be possible to remove all of the risk in a portfolio, it is possible to reduce the risk substantially by combining assets with low or negative correlations.
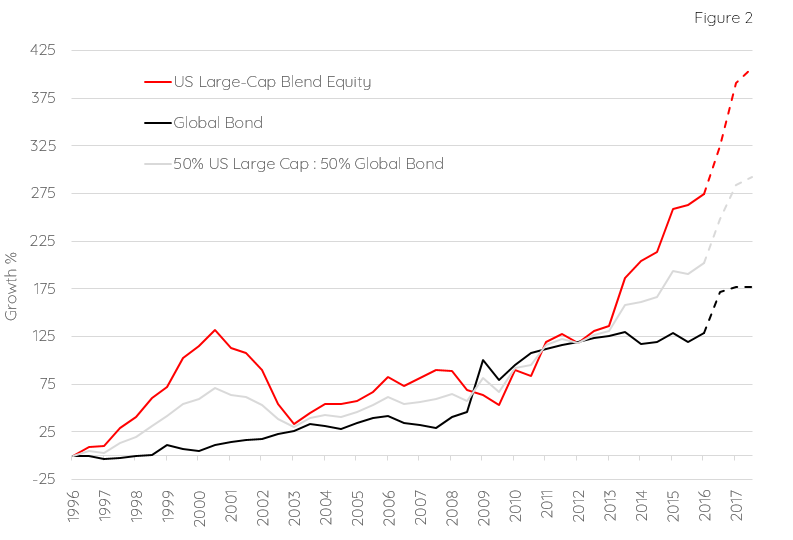
Over a twenty-year period, global bonds and US equities have been negatively correlated with each other whilst they both followed an upwards trend. The graph below shows performance of US equities and global bonds compared with a portfolio consisting of 50% US equities and 50% global bonds.
Over a twenty-year period, 1996 to 2016, global bonds returned a total of 130% whilst US equities returned a total of 275%. Individually, each asset class was relatively volatile.
When combined equally in a portfolio, the return would have been 202% but the volatility would have been substantially reduced. Compared to US equities alone, we would have achieved 73% of the return with only half of the risk. But, remarkably, when compared to global bonds alone, we would have increased the return by 70% whilst reducing the risk by 28%.

Reducing risk in a portfolio is important because it reduces the stress on the investor and it helps prevent an investor selling at the wrong time because of an emotional reaction to a sharp loss.
‘diversification is the only free lunch in investing’
The beauty of diversification is that it’s possible to reduce risk whilst maintaining or improving returns, which might explain why it is often referred to as ‘the only free lunch in investing’.
Important Information
If you have any questions on the above or to find out more about our investment service, please call 020 7287 2225 or email hello@edisonwm.com.
This document does not constitute advice.
The value of investments and the income arising from them can go down as well as up and is not guaranteed, which means that you may not get back what you invested. Past performance is not necessarily a guide to the future.
The above charts are for illustrative purposes only. Where referred to, ‘Global Bonds’ and ‘US Large-Cap Blend Equities’ are based on the Morningstar open-ended categories. The example is based on hypothetical and simulated modelling which has many inherent limitations and is generally prepared with the benefit of hindsight. There are frequently sharp differences between simulated results and the actual results. There are numerous factors related to the markets in general or the implementation of any specific investment strategy which cannot be fully accounted for in the preparation of simulated results and all of which can adversely affect actual results. No guarantee is being made that the stated results will be achieved.
The period used for our analysis is 1 January 1996 to 31 December 2016. The graph above spans, including the dashed lines, the period 1 January 1996 to 30 June 2017.
Data sourced from Morningstar.
Contact us to see how we can help.
+44 (0) 20 7287 2225
hello@edisonwm.com
The value of investments and the income arising from them can go down as well as up and is not guaranteed, which means that you may not get back what you invested. Past performance is not necessarily a guide to the future. The information contained in this website does not constitute advice. The FCA does not regulate tax advice. The FCA does not regulate advice on Wills and Powers of Attorney. The Financial Ombudsman Service is available to sort out individual complaints that clients and financial services businesses aren’t able to resolve themselves. To contact the Financial Ombudsman Service please visit www.financial-ombudsman.org.uk.


